The NHL is considering getting rid of the shootout. They’re currently testing the effects of playing overtime as 3 vs 3 (as opposed to the 4 vs 4 currently in use), hoping it’ll lead to more games getting solved in the overtime instead of the shootout. The Swedish league is moving to that format over the Christmas break, or so I heard.
Now, I get the desire to get rid of the shootout. I’ve never been a fan of the format. It seems incongruous to find a solution to a team sport in singularly individual contest. And that’s why I’m not particularly fond of the 3 vs 3 format, either. It’s not really that much of a step away from individualism. I’m not saying individual skill cannot solve the game, or that there is something wrong if such a thing happens. As long as it happens in the game. We don’t have to change the game into a measure of individual performance and luck.
Besides, it’s boring. The time it takes to prep the ice, and the teams and referees to get everything ready, the flow of the game is gone. The audience is already pulling on their coats, thinking of the fastest route home. I saw that first hand in the last game I went to, Espoo Blues hosting SaiPa: the overtime was fun and thrilling, but the shootout just killed the buzz.
The simple solution would be to double the overtime. Play 10 minutes as opposed to 5. And if played with second period ends (that is, with the longer distance to the bench), I’m guessing we’d have more games ending in overtime. But it would be a played solution, unlike in the shootout.
But here’s the thing: why do we need to find out the winner? I looked at the regular season standings in the NHL, and there’s teams with equal winning percentages. If we take winning percentage as the measure of team quality (ignoring the unbalanced schedule here for convenience), wouldn’t it be that two teams with equal winning percentage should result in a draw? Because they’re of equal quality. Why do we need to find out a winner?
This has been bugging me for quite some time. So I decided to have some fun with the regular season standings in the NHL for the last 9 seasons, that is, from 2005-06 to 2013-14.
The Era of the Shootout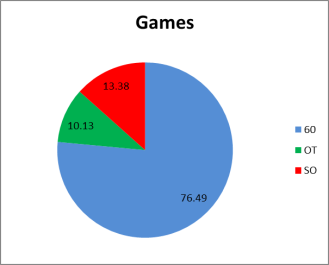
In the 9 seasons a total of 10560 games were played. (The 2012-13 season was of course shorter due to the lockout.) The chart on the left shows the shares of different solutions over the total games of the 9 season period. 60 meaning regular game time, OT for overtime and SO for shootout. Out of the total games played 23.51% (2483 games) went on overtime.
As can be seen, however, the overtime isn’t very effective. On average, only 43% of games that went on overtime were actually solved on overtime. (The seasonal figures range from 38.9% to 49.9%.)
It would seem, then, that the NHL is on the right track. The overtime as it is, is a rather inefficient way to find out which team is better. But I must ask again, if the two teams can’t find out who’s better in 65 minutes of active game time, is there a significant enough difference? Or could we just agree that they’re of equal strengths?
Three alternatives
I decided to compare three alternative policies, and see how the competitive balance in the league and the teams making the playoffs would differ.
– Alternative 1: the status quo. That is, all games are played till we have a winner. The regular game time is followed by a 5 minute overtime, played 4 vs 4, with sudden death. If there’s no solution on overtime, a shootout is played. The winner gets 2 points, the losing team none, unless there’s overtime/shootout, in which case he losing team gets 1 point.
– Alternative 2: the no-overtime policy. All games are 60 minutes, and it the score is tied, the game is a draw. Winner gets 2 points, losing team none, and in the case of a draw, both teams get 1 point each.
– Alternative 3: the overtime policy. If the game is tied at the end of third period, an overtime is played. If the game is tied at the end of the overtime, the game is a draw. Points as above.
I didn’t control for the strength of schedule when calculating the winning percentage, for the sake of simplicity in calculations (which, of course, is the academic speak for “couldn’t be bothered”). And of course there is the possible moral hazard bias in assuming the games that went on overtime would have ended as a draw under alternatives 2 and 3, as some teams in some games might have less desire to fight for the second point at the risk of losing the game, preferring to secure the point from making it to the overtime, or playing it safe on overtime thinking they are going to be stronger in the shootout. Again, simplicity of calculations ruled that out. And this time I actually mean it, it would had been rather cumbersome to approximate for that.
The measure of competitive balance I used is the simplest version, that is, the basic standard deviation of the winning percentages. I did considered using the ordered probit model of Ruud H. Koning (Balance in competition in Dutch soccer, The Statistician, 2000, 49, Part 3, pp. 419-431) to estimate the competitive balance measures in a league that allows for draws, but decided to save that for another day, another blog post. If nothing else, it’ll give us something to look forward to. (No? Just me then.)
The Noll-Scully approach
The argument presented by Roger Noll (Professional Basketball, Stanford University Studies in Industrial Economics Paper no. 144, 1988) and Gerald Scully (The Business of Major League Baseball. Chicago: University of Chicago Press, 1989) was that “a natural way to measure the degree of competitive balance in a league is to compare the actual performance of a league to the performance that would have occurred if the league had the maximum degree of competitive balance in the sense that all teams were equal in playing strengths” (James Quirk and Rodney D. Fort, Pay Dirt. Princeton University Press, 1992, p.244). The following definitions and explanations for the actual and ideal competitive balance are also from Quick and Fort.
The actual standard deviation (ASD) is calculated as follows: The difference between actual winning percentage and the league average (=0.500) is calculated for each team within season. The difference is squared. The squared differences are then summed over all teams, and divided by the total number of teams in the league. The square root is taken to get the standard deviation of the league winning percentages for the season.
For alternatives 2 and 3 the winning percentage considers a draw as “half a win”, so it’s (wins + 0.5 x draws) / games played. While this is a crude simplification, it has been used in sports economics literature. As mentioned above, a more sophisticated method of measuring competitive balance in a league with draws will be returned upon in a later post. For the time being, draws as a half a win shall suffice.
The idealized standard deviation (ISD) is simply the standard deviation of a league where all teams have the winning percentage of 0.5. The value of ISD depends on the number of games in the league, and can be defined as 0.5 divided by the square of games per team. For the seasons under study here, that’s 82 games, except for the 2012-13 season when each team played only 48 games.
Using then the Noll-Scully approach, the degree of competitive balance in a league for each season can be evaluated by comparing the actual and ideal standard deviations. This gives us the ratio of standard deviation (RSD): the actual divided by the ideal. The closer the ratio is to 1, the more competitively balanced the league.
The ASD and RSD for the NHL in the nine season under study are as below, calculated for all three alternatives.

Unsurprisingly, alternative 2 (without overtime) has the lowest standard deviations (that is, RSD’s closest to one) in majority of cases. This follows from the largest number of draws. Notably there is not much difference between the RSD’s for alternatives 1 and 3, that is, the status quo and the plan without the shootout. Eliminating the shootout would, it seems, level the competition, but only slightly. It would not hide the differences in strength between the teams.
.. and the points don’t matter?
Because the ranking of the teams is ultimately not done by the winning percentages but by points, I also calculated the actual standard deviations of points.

The problem here is that the total number of points in a season varies under the current system. In any game, either two or three points are rewarded to the teams, depending on the game outcome. Thus the total points in a league can be anywhere between 2460 (all games 2-point games, that is, ending on regular time) to 3690 (all games 3-point games by going on overtime) points. Across the 8 full seasons the average number of total points was 2750.
In terms of points, the alternative 3 provides less competitive balanced league than the current system of alternative 1. However, the differences in RDS’s are small. It could therefore be argued, that even with games resulting in draws, we can rank the teams by competitive strength.
Do we need to win every game?
It would seem, given the above, that there really is no reason for the shootout. The league would not suffer in terms of competitive balance if we allow for games to end in draws. In fact, the season would be more balanced, and thus probably more exciting to watch. The ease of ranking the teams would not be affected, as the differences in points still occurred, and to a very similar degree. But we wouldn’t have to sit through lukewarm endings of watching the zamboni make its rounds and the referees having a chat, all for a blink-and-you-miss-it stroke of individual luck.
